November 21st, 2024
New
Improved
New
Global Objectives: assess overall infrastructure performance at a glance by drilling into any live objective on slaOS. This addition allows you to seamlessly move between a high-level understanding of your system's performance and detailed consumer-level performance, ensuring not only robust infrastructure performance but also consistently happy consumers. Oh also, welcome to the dark side (yes, we heard you. dark mode rules!) ✨
note: you can switch between dark and light mode by clicking on your profile in the upper-right corner of the navigation bar and selecting your preferred mode under "Theme."

Updates
We've also revamped key aspects of the interface to elevate your experience.
Tables are now wider and more spacious, providing a clearer, less constricted view of your data.

Pills have been redesigned for a more modern look, and titles have been resized for better readability and balance.

These updates ensure that navigating and analyzing your metrics is not only more intuitive but also aesthetically pleasing. With these enhancements, your workflow feels as smooth as it looks.
November 15th, 2024
New
Improved
Fixed
New
Added an interactive month carousel to the SLA and SLO performance over time charts, allowing users to focus on the most recent months
Updates
Added autocomplete suggestions to multi-metric SELECT queries in the SLI definition flow, displaying available metrics as you type to make metric selection faster and more accurate

Fixes
Fixed how we display SLO breaches in the calendar view to better reflect their actual status
Previously, when an SLO went into breach (e.g. on Sept 5th), subsequent days would incorrectly show as orange/warning even though the SLO was still in breach and performing below target

Now, all days where a breached SLO performs below its daily target will correctly show as red/critical (ex Sept 27th), providing a more accurate visualization of the breach's duration

November 8th, 2024
New
Improved
New
PromQL Integration: We've added support for PromQL in our data integration platform, enabling seamless onboarding of Prometheus data to slaOS. The integration includes comprehensive authentication options:
Basic Authentication
Token Authentication
Certificate Authentication (mTLS)
Google Cloud Authentication
You can either:
Self-host using our configuration templates (available in our GitHub repository)
Use our dashboard for a guided setup experience
This integration allows you to leverage Prometheus metrics within slaOS to build and monitor SLAs. For detailed instructions, please refer to our Prometheus Integration Guide.
Sources launched! The new sources page is now live, showcasing all data source integrations supported by slaOS. You can explore detailed integration guides for each supported source. In the coming weeks, we'll introduce new interfaces to streamline data ingestion directly through the slaOS dashboard

Updates
Performance Updates:
Increased the default batch size for event ingestion from 50 to 100, improving data handling capacity
Enhanced event generation and posting processes to support concurrent operations, enabling faster and more efficient data ingestion
Improved performance in user profile retrieval by implementing a cached mechanism for fetching user details, with an option to bypass the cache for unverified emails
October 25th, 2024
New
Improved
Fixed
New
Freeform SELECT clause in SLI Builder: Users can now create SLIs using free-form SELECT clauses with enhanced SQL query handling. This includes support for arithmetic relationships between multiple metrics in the SELECT clause.
Example:SELECT AVG(internal_timestamp - external_timestamp) FROM key1 WHERE status = "COMPLETED".Note: Aggregation functions are required in the SELECT clause for complex relational queries.
Updates
Breach start time for interval based SLOs: We’ve introduced the
breach_starts_atfield for interval-based SLOs to enhance breach tracking. This addition provides greater context on the SLO’s state over its compliance period. You can view the breach start time by clicking the</>inspect icon on the SLA details view.
Fixes
SLA calculation for mid-month starts: We resolved an issue causing compute errors when SLAs began mid-month.
Improved data handling for interval exclusions: Charts now correctly show "no data" for interval-based SLOs where missing intervals are set to "exclude."
October 18th, 2024
Improved
Fixed
Updates
Clickable SLA rows: You can now click anywhere on an SLA row or card to access detailed information. No more hunting for that tiny arrow icon – just click and go!

SLO counters: We've added a counter showing the number of SLOs for each SLA in the Organization page to help you quickly assess the complexity and scope of your SLAs without needing to drill down into each one

Better charting for in-progress days: Computations for the current day are now represented by a dashed line in charts to tell you that data for the day is still being collected and may change. We hope it helps prevent misinterpretation of potentially incomplete information. At the end of day, the chart line will turn solid.
Performance boost with batch processing: We’ve implemented batch processing for OpenSearch writes and event generation.This behind-the-scenes change should result in noticeably faster data processing and reduced system load. You'll see quicker updates and smoother performance, especially when dealing with large volumes of data
Improved table sorting: We’ve updated default sorting for several key views:
SLOs are now sorted alphabetically by name. Alphabetical SLO sorting addresses the scenario with many objectives where you want to easily compare the configuration of Objectives with different targets (example
P90 LatencyandP99 Latency).SLAs are now ordered by end date, putting your most pressing agreements front and center.
Proactive data freshness: We’ve implemented automatic recomputation for SLAs not processed in the last 24 hours to ensure your SLA data is always up-to-date, even for less frequently accessed agreements.
Static SLA portal links: The SLA portal links are now updated to remain static upon deactivation and reactivation thereafter so that your active integrations don’t need to be updated.
Fixes
Error budget for in-progress day: Error budgets for the current day were incorrectly showing as zero when no data was available. We've corrected the client-side logic to properly display the error budget, even when today's data hasn't arrived yet to prevent false alarms and confusion.
Improved timezone handling: Some timestamps were being processed inconsistently across the system depending on the end user’s timezone. We've standardized timestamp handling, including making our event generator timezone-aware (defaulting to UTC). This fix ensures your data is correctly time-aligned and your SLAs are evaluated appropriately.
Correct handling of computation based on SLA policy period: Our SLA computation logic was not correctly aligning with the official start date of SLA policy periods. Instead, it was basing calculations on the first ingested data point for each SLO. We've updated our computation logic to properly account for the SLA's official start time, ensuring all relevant events/intervals within the policy period are included in SLA status calculations.
October 8th, 2024
New
Improved
Fixed
New
Enhanced SLA details on portal and admin dashboard:
No Data indicator: You'll now see a "No data for SLO" message when there's no data to compute. This addition helps distinguish between processing issues and genuine lack of data, improving your ability to troubleshoot and understand SLO status.

Top-level SLO metadata: The SLA portal now displays comprehensive SLO information including name, description, target, and compliance period details.

Daily summary statuses: We've introduced SLO-level status for compliance windows. Instead of just seeing an overall SLA status, you can now track the performance of individual SLOs within their specific compliance windows.
Debugging aid: To assist with troubleshooting, we've added a
last_update_atfield to SLAs (you can access this via the inspect feature). This timestamp indicates when our compute engine last processed the SLA, helping you distinguish between compute issues and missing data scenarios. Remember, our system recalculates SLO and SLA metrics each time a new event is indexed, so this field can be crucial in identifying the source of any discrepancies.Customer → Organization updates: We've made some changes to make our platform more inclusive and flexible:
The "vendors" table has been renamed to "organizations". This change reflects our recognition that both producers and consumers of SLAs can benefit from slaOS, moving beyond a vendor-specific approach.
In line with this change, we've updated the ingestion URLs to use
organization_idinstead ofcustomer_idas the unique identifier. This shift allows for a more versatile representation of entities using our platform.
Updates
Interval SLO description: We've refined the autofill description for interval SLOs to more accurately reflect the calculation method.
Calculation every 24 hours over a calendar period of 1 month→Interval based calculation every 24 hours over a calendar period of 1 monthStorage optimization: In an effort to improve system efficiency, we now automatically delete performance documents when an SLA is deleted. This change optimizes storage usage and helps maintain a cleaner, more manageable database.
Computation frequency: Based on user feedback about slow computation times, we've increased the frequency of our computation processes. This update should result in faster response times when viewing SLA and SLO data.
Compute process enhancements: We've made several behind-the-scenes improvements to our compute process:
Enhanced overall maintainability and performance, resulting in more efficient data processing.
Simplified and optimized the queries used to identify which SLAs/SLOs need (re)computation. This change includes the application of new indexes to improve query speed.
Implemented smarter filtering to avoid unnecessary compute on SLAs/SLOs that haven't received new data or are considered expired (end date several days in the past). This optimization helps allocate system resources more effectively.
Fixes
Backend improvements:
SLA identifier in performance documents: We've added the SLA Identifier to Performance Documents ID and Data. This fix resolves an issue where overlapping SLAs with the same SLO couldn't be distinguished.
Expired SLA handling: Our system now better handles expired SLAs, preventing unnecessary computation attempts on outdated agreements.
OpenSearch query optimization: We've addressed the
tooManyBucketsExceptionerror by increasing the bucket limit. This fix prevents 503 errors that were occurring when creating aggregations with a high number of buckets, ensuring more reliable data retrieval and analysis.Breach count handling: We’ve reduced breach cache period and don't cache 0 breaches anymore so that the breach details are refreshed on the interface accurately.
Frontend improvements:
White screen of death: We've resolved an issue where creating a new Objective (SLO) was resulting in a white screen after selecting an indicator.
Service Target for aggregated SLIs: Event based SLOs built using aggregated SLIs (ie Indicators that have an aggregation such as
avg,sum,countetc) can only have a Service Target of 0 or 100% and configuring anything else would result in an error. We’ve introduced a fix on the client side to eliminate cognitive load on the user so that they can only select either 0% or 100%.
Calculation corrections:
Error budget calculation: Fixed a bug where the error budget was incorrectly showing as 0 even when daily SLO compliance over the entire compliance period was above the target.
Compliant missing intervals: We've corrected the logic for handling compliant missing intervals. Previously, these were incorrectly shown as "missing" or "no data". Now, they're properly treated as compliant.
Cumulative calculation: Resolved an off-by-one error in cumulative calculations on error budgets. We now correctly index at the beginning of the day instead of the end, ensuring precise day-to-day tracking of your error budget consumption.
September 30th, 2024
Improved
Fixed
Updates
Customer Portal enhancements: We've made several improvements to the Customer Portal to enhance user experience and clarity:
Renamed to "SLA Portal": We've updated the name from "Customer Portal" to "SLA Portal" for better clarity on its purpose.
Improved Error Handling: We now display an error page for expired access tokens, ensuring users are aware of authentication issues.
Duration Information: Added a "Duration left" tooltip to provide users with clear information about remaining SLA durations.
Default Sorting: The SLA Portal now defaults to sorting by most recent entries, making it easier to find the latest information.
Mobile Responsiveness: Implemented a mobile version of the customer dashboard for on-the-go access.
Performance optimizations: We've implemented several backend and frontend optimizations to significantly improve system performance:
Faster SLA Processing: Optimized the backend to update SLA detects more efficiently, reducing the need to query numerous shards with billions of documents.
New Customer Breach Route: Created a dedicated route for customer breaches and implemented caching to improve response times.
Frontend Speedup: Optimized the
/statisticsroute on the frontend for faster data retrieval and display.Organization Naming: Standardized organization naming conventions across the platform.
Fixed
Event-based SLO Calculations:
Fixed an issue where incomplete compliance period windows were being counted for breaches in event-based SLOs.
Corrected the inverse
on_targetstatus rendering for event-based SLOs that certain users were experiencing.
SLA Status Display: Resolved a bug where in-breach SLAs were incorrectly showing a
OKstatusUser Navigation: Corrected the landing page for users to
/gettingStartedinstead of/customersSLA Calendar picker behavior: There were certain inconsistencies between SLA duration descriptions and actual periods that were selected when a user sets the SLA policy duration. This along with correction in the logic for preset SLA durations ensures the SLA policy duration works with accuracy.
September 27th, 2024
New
Improved
Fixed
New
Customer Portal: We're happy to announce the launch of our long-awaited customer portal! Starting today, vendors can publish their SLAs to a customer-facing interface, enabling your clients to track and manage their SLAs effortlessly.
Key features:
Customizable dashboards with your branding and logo
Top-level SLA metrics including status, active SLA count, and breach count
SLO performance over time charts
Dedicated URL for each customer, easily embeddable in your existing product

The customer portal provides critical information that your customers care about, helping them stay informed about your service quality. While this is just the first iteration, plans for future enhancements include:
SLA reports
incident management
information on remediation
You will find a dedicated URL for your customer dashboard on the customer portal which stays accessible while active. Find more details about how to configure a customer portal on our docs!

rated-log-indexer is now source available!! The rated-log-indexer is a powerful tool designed to collect and process logs and metrics from various monitoring solutions and ingest them into slaOS. This indexer supports multiple data inputs, allowing you to centralize your monitoring data for efficient analysis and visualization. We’re launching today with CloudWatch and Datadog support. Check out our Github repo by heading here → https://github.com/rated-network/rated-log-indexer
Amber code for SLA status: We've introduced a new color code to our SLO performance charts: amber. This new state indicates that an SLO is off target but not yet in breach. By adding this intermediate status, we aim to:
Improve awareness of potential issues before they escalate
Enable teams to take proactive measures to bring performance back on track
Provide a more nuanced view of SLO health

[PR #41] Sentry Setup for rated-log-indexer: We've implemented Sentry SDK support to enhance error tracking and performance monitoring. This integration includes:
New configuration options in the application settings
Updated
rated-config.example.yamlwith new fields for logging and output configurationsStreamlined overall structure by removing unused and deprecated configurations
Updates
[PR #45] Multiple indexers sending same key: We've enhanced our rated-log-indexer functionality to allow multiple indexers for the same integration (e.g., CloudWatch) to use the same
keyfor ingestion. This update:Streamlines key management
Enables parallel indexer operation without key conflicts
Simplifies configuration for multi-indexer setups
Loader for SLI dropdowns: We've added a loading indicator for SLI field mappings and indexed fields. Instead of displaying an empty list while data is being fetched, users will now see a loader, improving the perceived responsiveness of the interface.
SLA List UI: The SLA list under a customer is now collapsed by default, allowing for easier navigation and a more optimized view when dealing with multiple SLAs.

CloudWatch Integration Pagination: We've implemented pagination for the
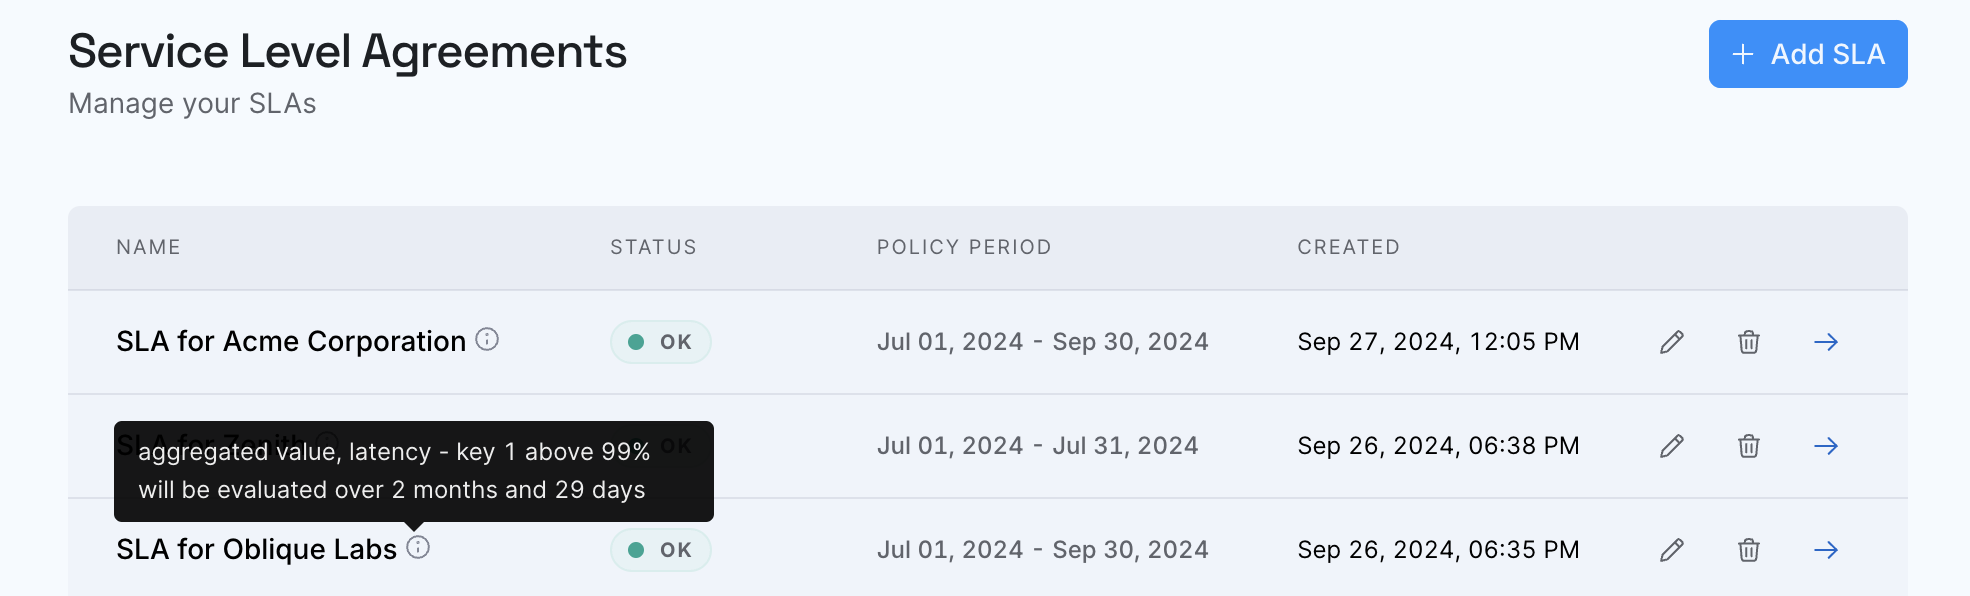
list_log_groupsfunction in our CloudWatch integration, improving performance and reliability when dealing with large numbers of log groups.SLA Table UI: SLA descriptions on the SLA list page are now available via the info icon (i) next to the SLA title.
Fixes
Create SLA UI fix: When adding multiple SLOs in a SLA, we received reports that some times SLO cards were not aligned appropriately and the delete (x) icon across multiple SLO cards were not aligned. This issue has now been fixed!
Make Datadog’s logs timestamps UTC: Currently, the timestamp object returned from Datadog is in
timezone.localtime, but they index in UTC. We’ve pushed a fix to make sure we convert the local time to UTC before it is ingested by our indexer.Datadog Integration Log Parsing: We've resolved issues with log parsing in our Datadog integration, ensuring more accurate and consistent log data retrieval.
Indexer Retry Behavior: We've addressed issues with the indexer's retry mechanism, improving reliability and reducing the likelihood of data loss during temporary system or network issues.
September 18th, 2024
New
Improved
Fixed
New
[PR #33] Idempotent key to rated-log-indexer: Extending on the support for idempotent key for ingestion via Data API, we’ve added support for
idempotency_keyfor the indexer to improve event identification and processing.Spin that hourglass! A small win for all enjoooyers of an interactive web app - the hourglass on your SLA pages while the SLO data is still being computed, spins ⌛

Added Terms of Service to docs.rated.co
Updates
[PR #37] secrets manager dictionary support and improved error handling on rated-log-indexer
Enhanced error handling for configuration loading and secret resolution
Support for resolving secrets as either strings or dictionaries
Updated documentation on referencing secrets in AWS Secrets Manager
Improved error messaging for configuration file and secret resolution issues
Fixes
Pill and chart color for "Today": We’d previously been showing the color of both the pill and line chart for the most recent data as red. We’ve fixed this to now be a neutral color to indicate that the day is still in progress and we’ll give you the performance details once the day has exclipsed.
Pagination Fix: Clicking on a sidebar link twice was returning NaN page param in the query. This has now been fixed.
Inactive SLA fix: We fixed a bug where SLAs that have finished didn’t show any slo charts. All SLAs that are not active will now show the most recent compliance period’s graphs.
[PR #34] Add validation for value names, to remove special characters on the indexer.
Enhanced log parsing functionality with improved input string sanitization.
Improved handling of integration prefixes during batch sending for increased flexibility and robustness.
September 9th, 2024
New
Improved
Fixed
New
Customer dropdown: We've added a new feature that allows you to retrieve all customer IDs that slaOS ingests during the customer creation process. This enhancement provides easier access to customer information and streamlines customer management workflows.

SLA Breaches: You can now view the total number of breaches during an SLA policy period on a per-customer basis.
Key points:
A breach indicates that your SLO was below target and has consumed all its error budget for its compliance period
The breach count does NOT reset upon compliance period reset
Your error budget will be replenished at the start of your next compliance period

Updates
We've improved the SLA management process by adding the ability to edit SLA names and descriptions. To access this feature:
Navigate to the Agreements section
Select the pencil icon next to the SLA you wish to edit

Fixes
Burndown Calculation: We've addressed an issue with error burndown calculations for event-based SLOs. The logic has been corrected as follows:
The error budget burndown starts at 100% at the beginning of the compliance period
The chart can now fluctuate up and down, accurately reflecting the changing ratio of errors to total events
As new events occur, the error budget adjusts, and the burndown chart reflects these adjustments in real-time

Performance Optimisations: We've implemented several optimizations to improve system performance:
Enhanced compute and retrieval engine for faster SLO performance data retrieval.
Bug fixes and compute optimisations specifically for rolling window type SLOs.
These improvements should result in faster load times and more responsive performance across the platform.